Charst
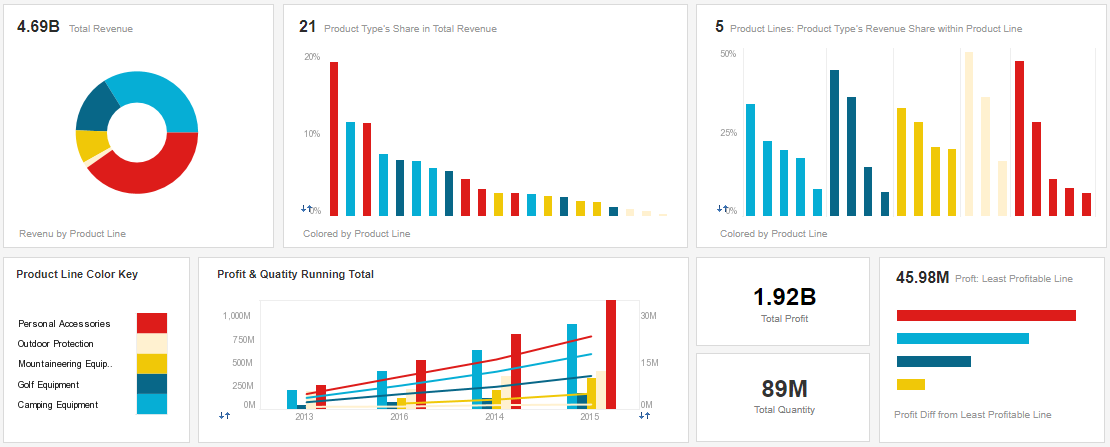
Charts are far better for displaying data visually than tables and have the added benefit that no one is ever going to press-gang them into use as a layout tool. They’re easier to look at and convey data quickly, but they’re not always easy to create.
<!DOCTYPE html>
<html lang="en">
    <head>
        <meta charset="utf-8" />
        <title>Chart.js demo</title>
        <script src='Chart.min.js'></script>
    </head>
    <body>
    </body>
</html>
Types:
- line chart
- pie chart
- bar chart
The < canvas> element
< canvas> looks like the < img> element, with the only clear difference being that it doesn’t have the src and alt attributes. Indeed, the < canvas> element has only two attributes, width and height ### The HTML < canvas> element is used to draw graphics on a web page.
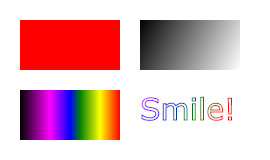
Example :
<canvas id="myCanvas" width="200" height="100"></canvas>
example 2:
function draw() {
  var ctx = document.getElementById('canvas').getContext('2d');
  for (var i = 0; i < 6; i++) {
    for (var j = 0; j < 6; j++) {
      ctx.fillStyle = 'rgb(' + Math.floor(255 - 42.5 * i) + ', ' +
                       Math.floor(255 - 42.5 * j) + ', 0)';
      ctx.fillRect(j * 25, i * 25, 25, 25);
    }
  }
}
 __
__
Canvas Text
To draw text on a canvas, the most important property and methods are:
- font - defines the font properties for the text
- fillText(text,x,y) - draws “filled” text on the canvas
- strokeText(text,x,y) - draws text on the canvas (no fill)
example:
<script>
var canvas = document.getElementById("myCanvas");
var ctx = canvas.getContext("2d");
ctx.font = "30px Arial";
ctx.strokeText("Hello World",10,50);
</script>